

Ratio analysis vs. company financial health in-dept analysis
The purpose of ratio analysis is to determine whether an entity achieves its objectives. This article provides a means of a systematic review of financial statements.
Uses of ratio analysis
As a finance manager, you have to compare to get the meaningful information from the ratio analysis. Comparing proportions over time within the same sector to establish whether the business is improving or declining, and comparing ratios of similar companies to see if the company being analyzed is better or worse than average within its own business sector.
Users of financial statements
Investors will be interested in the risk and return Suppliers and loan creditors are interested in receiving the payments due Managers use this ratio to see how well the business is being run
Limitations of ratio analysis
Although ratio analysis can be a beneficial technique, it is crucial to realize its limitations.
- Availability of comparable information – when comparing with the other industries, we can identify many variations in figures.
- out-of-date information – We only use past data to analyze the data.
- Ratios are not definitive.
- Need for careful interpretation – when comparing two firms, you may come across the fact that one is having a higher liquidity ratio than others. When we deep down to each firm analysis, this has happened due to higher inventories, which is unfavorable.
- Manipulation – Manipulation of accounting policies may lead to entirely different performance levels to analyze.
Key financial ratios
There are four types of financial ratios.
- Profitability and return
- Debt and gearing
- Liquidity: control of cash and other working capital items
- Shareholders’ investment ratios (or ‘stock market ratios’)
What are the three main profitability ratios?
1. Return on capital employed (ROCE)
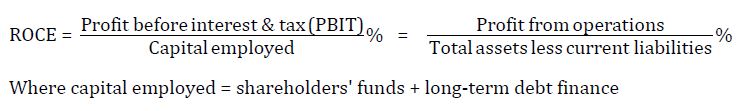
This ratio will help to determine the following things – How risky is the business, is it earning enough to be able to cover the costs of extra borrowing,
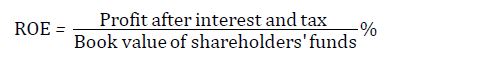
2.Return on equity (ROE) (return on net assets)
3. Asset turnover

This measures how efficiently the assets have been used.
4. Profit margin

What are the debt and gearing ratios ?
1. Debt ratio
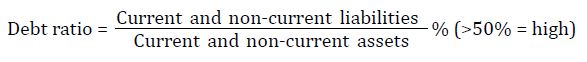
What is a good debt ratio??
Favorable debt ration is less than 50% of the above ratio.
2. Debt: equity
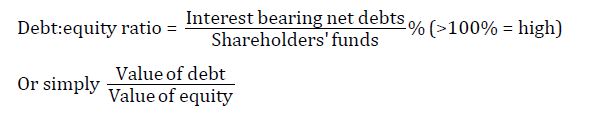
What is a good debt to equity ratio??
Favorable debt to equity ratio is less than 50% of the above ratio.
3. Operating gearing (leverage)

4. Interest cover

How to calculate liquidity ratio?
There are six types of ratios we can identify under liquidity ratios.
1. current ratio / how to calculate the current ratio ?

What is a good current ratio ?
2:1 can be taken as an excellent current ratio for a company. This means you need to have two current assets to offset one liability. This ratio is always not the best. (Industry Norms)
How can a company improve its current ratio?
As much as current assets are high, this ratio becomes favorable. As a finance manager, you need to deep down to current assets & look into the consist of current assets. For instance, the current ratios become favorable due to the higher inventory, then this can be taken as a good indication.
2. Acid test ratio / Quick ratio

3. Receivables collection period (receivables days)

4. Inventory days

5. Payables payment period (payables days)

6. Cash operating cycle
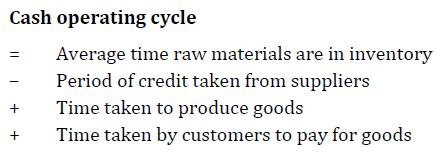
Find out more on cash operating cycle
How to calculate investment ratios ?
1. Dividend yield ratio

If the final result is a lesser value ( Lower Yield ) means this company has focused more on the reinvestment of the profits they earn.It there is a higher yield means company heavily pay dividends to their shareholders and the company is heading to a risky area in the future.
2. Earnings per share

3. Earnings yield

If you are a rational finance manager , now you have doubt on how there can be a difference in EPS and MPPS ( Market Price Per Share ) values.The difference has occurred due to the P/E ratio . P/E ratio shows the investor’s confidence in the market about that particular share.

Based on the above equation, we can see that MPPS is a combination of both EPS and P/E ration. Think of a situation where EPS has a lower value. But in this situation, shareholders have the same confidence as before on the company. Then MPPS tends to increase regardless of the EPS value. Therefore P/E ratio is the upside down of the earnings yield ratio.

4. Dividend cover
